Advanced State/Status View

So I am trying to build a state view that will show logical disks that are alerting on Low Disk space. While it's easy to create a State/Status view of Logical Disks in Critical states, I'm not having much luck in just showing those that are alerting or "Low Disk Space". When I create the

…this seems like it’s simple and I’m missing something…someone please set me straight.

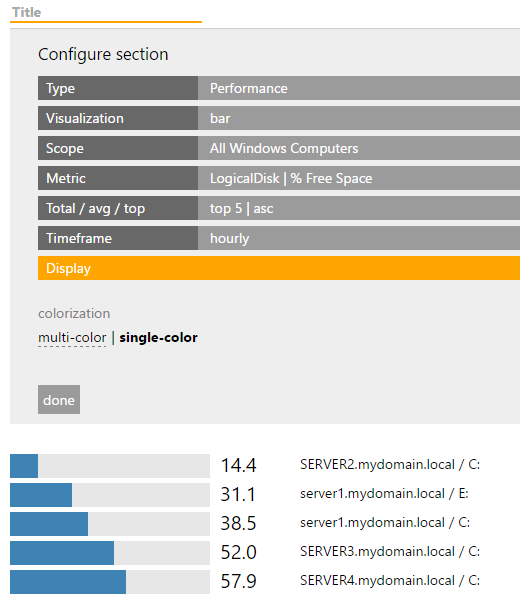
You could achieve something similar to what you’re looking for with the Performance plugin, as below (you could then show the health states with Health State Highlighting). I’m not sure you can get what you're looking for with the Status plugin.

To show the health of specific monitors you might want to use an alert section instead.

So in this case you would simply show all ‘Logical Disk Free Space is low’ alerts, like so:

Capture2.png

Capture.png

1 Like

We achieved something similar by combining the two.

We showed the low memory and high CPU usage using the Performance plugin,

In your case, show the logical disk space.

and then used the KB article from SquaredUP

http://support.squaredup.com/support/solutions/articles/210588-how-to-enable-health-state-highlighting-for-performance-graphs

To change the colour of the relevant servers (disks in your case) to Red when an alert is triggered.

I set it to show the top 5 servers - here’s a part of the dashboard showing the server that turned red when an alert was triggered.

.

If you included an alert display within your dashboard, you should have everything you need.

3 Likes

This looks great, I’ll give it a try also!

I should have mentioned, our management groups are large, so for our NOC view, we don’t use the Top N Bar views; those work best in our environment when we scale them down to specific system groups. Otherwise, this is what I would normally want to show. :slight_smile:

…now that I read this for the third time, I see you’re telling me that I cannot do this with the State view. It must be done through the alerts view. :frowning: