How do i find which metrics are available?
Hi Sebastian,
Are you using v2 or v3?
In v2 you navigate to an object, whether this is a computer object or a website etc, then click the View Performance button at the top:
In v3 the performance metrics can be found on the Performance perspective of an object:

In both cases, when creating a performance section / tile, you can press the down cursor key and a full list of available metrics for that object will be displayed.
Cheers,
Jelly
hmm, I’ve just tested by pressing the down arrow and nothing happens on v3.
As per the video here: https://www.youtube.com/watch?v=9DzfnvVwzLU
I have created a test tile with a scope of ‘All Windows Computers’.
Yet nothing appears when I go to Metric - I also just scoped one of my DC computers to no avail.
I have the AD management pack installed directly from the Management Pack catalogue.
Unfortunately no luck with this, maybe I should reinstall squaredup.
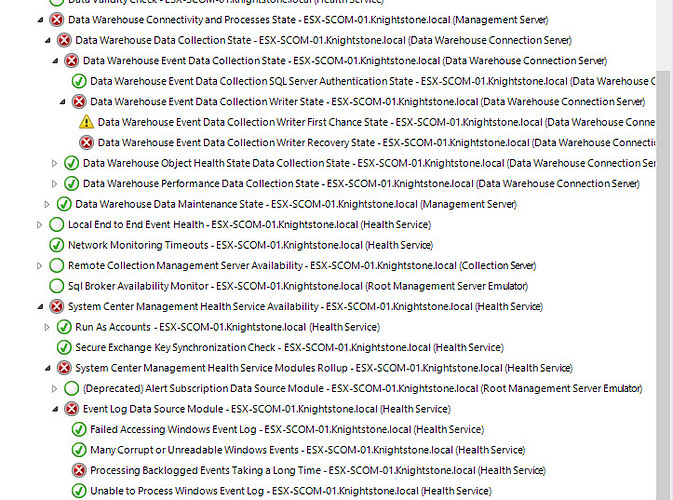
I have contacted support. I do have lots of errors on my SCOM server in particular data warehouse - have been unable to correct these. I am on SCOM 2012 R2 UR11 - I've seen UR12 is out but unsure whether that would resolve these.
As per your other post, where you have specified a group, Squared Up is trying to look for metrics targeted at that group.
If you enter a Windows Computer into list scope and press the down arrow on metrics, you’ll find metrics are returned 
I’ve done this and nothing is displayed when clicking the down arrow.
Hello,
Are you able to try this a test object in the first instance.
Presuming you have to Active Directory Management Pack installed you could try this with a Domain Controller. As the metrics list will be quiet extensive.
If no metrics are being displayed it could be a case of a incorrect management pack, where a re-download from a trusted source should fix this issue.
Hello,
I think I have a lose scope on the issue you are having.
Bar going to support for further assistance, are you able to try the following:-
- Select the performance tile - Select desired state tile || I selected the performance Bar graph
- select list under scope - Select a server || I selected a file server
- On the metric tile type memory * the list should populate, the options I see are the following:-
Memory - Available MBytes
Memory - Free System Page Table Entries
Memory - Pages/sec
Memory - PercentMemoryUsed
Memory - Pool Nonpaged Bytes
Memory - Pool Paged Bytes
These should come with SCOM out of the box. - click next for the next 2 tabs.
As a side note do your servers generate a list when you are defining the scope?? Also is this the only tile that doesn’t load any form of metric?
It could be case where the scope you are trying to get the performance metric against, is too vast, and therefore no metrics will load.
Try reducing the scope.
Hope this helps,
Chris
Hello,
Before that is done consult with SquaredUp Support, as they should be able to assist with the problem you are having, and hopefully come to a resolution.
Chris
You have issues with your data warehouse that need to be resolved prior to Squared Up working properly

