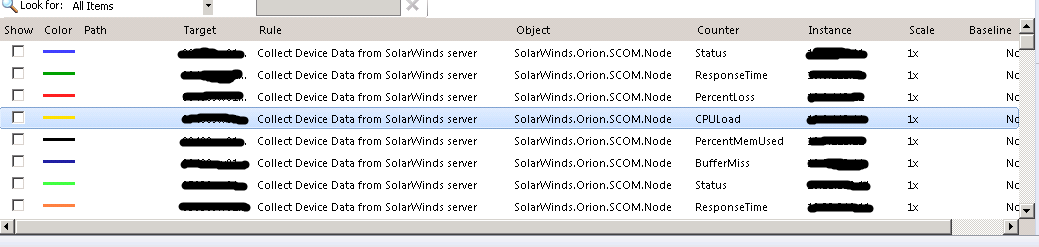
I am using the Solarwinds connector to pull data from Solarwinds into SCOM. Within the SCOM console, there are performance graphs that show network interface metrics:
I am trying to recreate those graphs within SquaredUp using the Object/Counter/Instance names as shown in my screenshot above. So for example, the Object would be “SolarWinds.Orion.SCOM.Node”. The Counter would be CPULoad. The instance would simply be the IP address of the device.
However when I try to recreate that performance dashboard within SquaredUP, SquaredUP does not seem to be able to access that performance data. When I specify that same network device and then hit the down arrow to get the list of available performance counters I only see this:
So it appears that the only performance metric it can pull is the hardware status. Using the advanced menu option to specify “SolarWinds.Orion.SCOM.Node” as the object makes no difference as the graph says “no available data”.
What counters specifically are you interested in viewing?
I struggled with this as well using the Orion MP. I am only using it to monitor the hardware of my switches as I don’t have that covered with any other management packs. If you are interested in interface monitoring, you are better off using the default metrics SCOM collects, although you will have to enable these rules, as they are only enabled for interfaces you explicitly want to monitor.
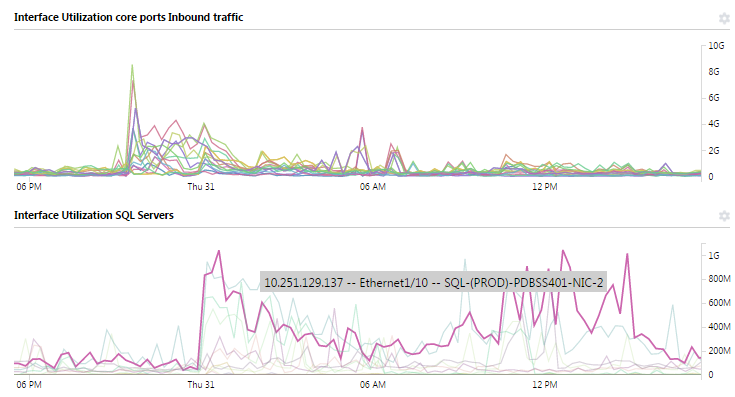
I would also advise that, should you use the out of the box interface monitoring of SCOM, to use this management pack that changes the displaynames of the interfaces to a more readable format. This allows for much betterdashboards within Squared Up. Here’s the link:
As clarkd suggested, it might be that the dashboard is scoped to the wrong object, because they have the same name but are actually different types (SCOM classes). For example, “SolarWinds.Orion.SCOM.Node” vs “SolarWinds.Orion.SCOM.HardwareHealth.HardwareInfo”. (To add to the confusion, these are also the “object” names used for the performance counters.)
The SCOM Console view is showing objects of class “SolarWinds.Orion.SCOM.Node” so try to reproduce that in Squared Up.
Try the following:
Create a new dashboard, and add a Status section
Choose Scope > Advanced
In the Class box, enter "SolarWinds.Orion.SCOM.Node" (this is scoping to all objects of this class)
Make sure a list of objects appears
Either drilldown into one of these objects and click "view performance" or -
Change the section type to Performance
Choose Metric, and press the down arrow to see all available metrics
I’m having the same problem with Solarwinds MP aswell as different MP called Metrex Cisco Monitoring which is trying to monitor the performance graphs for Jitter Packet Loss, I just get no data in SquaredUp but the performance graphs appear in SCOM.
We finally have an answer for this. Thanks to neilhallyburton for his assistance.
As you may know, Squared Up pulls all performance data from the SCOM Data Warehouse, not the SCOM Ops DB. Unfortunately, the SolarWinds MP doesn’t correctly insert data into the SCOM DW because it breaks the rule of “one counter per collection rule”.
Oleg Kapustin explains this concisely in his blog:
This is yet another call for SCOM Management Pack developers: never ever try to implement dynamic object and counter names for performance collection rules! This has been explained billion times by many people (including myself), but I have faced (and successfully terminated) another attempt to do that again.
The reason for not implementing dynamic object and counter names for performance collection rules is simple and straightforward: this kind of implementation is not supported by OpsMgr data warehouse. Take a look at dbo.PerformanceRule table and note that CounterName andObjectName columns are stored there, RuleRowId is a primary key. That means that one and only one object\counter pair can be stored for a given rule. One. No exceptions.
In the SolarWinds MP, the "Collect Device Data from SolarWinds server" performance collection rule collects all performance counters (for all nodes). There are good reasons for doing it this way - namely efficient querying of the SolarWinds database - but unfortunately it does not work with the SCOM Data Warehouse.
The result is that all the performance data is collected and stored in your DW, but the DW can’t distinguish what data points are for what counter (because they all reference the same collection rule). Using Squared Up, if you drilldown into a Node and export the “status” performance graph to Excel, you’ll see multiple data points for the same timestamp - each data point is actually for a different performance counter but you can’t tell which.
Thanks for your time today Richard and getting an answer to many people’s problem.
I too will log a support call with Solarwinds to back up WilsonWong hopefully they will recognise the need to fix this.
WilsonWong, do you have a support ticket number from Solarwinds so I can reference it?
Just wanted to give everyone an update on this…It’s been well over 3 months since I submitted my case to SolarWinds about this and they have not yet provided an update or a response. All I’ve gotten is that they forwarded my case to their developers and have yet to hear back from them.
Some of the others here mentioned that they would open cases with SolarWinds as well. Any progress on your fronts?
Update just in case anybody was still interested in this. It’s been a year since I had originally submitted my support case to SolarWinds. I recently re-opened the case asking them if they were ever going to fix this issue or release an updated MP with support for SCOM2016 and they said they had no plans to do so.
I’m trying this Solarwinds MP by Ruben but I can’t get data. My data in the reg file works when using a tool like Postman and the server shows up in SCOM, but no data in Switches, Routers, etc. Any ideas from anyone who has successfully implemented Ruben’s MP?
We are currently in the middle of the process to purchase a license for SolarWinds. In our preliminary investigation we found this problem to be an issue to us too (but unfortunately not enough of an issue to stop the purchase).
In any case, we worked with SolarWinds support to open a case, but have been told that this is a feature request, not a bug.
In response, we have filed an official feature request which can be found at this location:
Fix the SolarWinds/SCOM MP so that data is correctly written to the SCOM Data Warehouse
https://thwack.solarwinds.com/ideas/10146
If you are so inclined, please up-vote the request.
What is your page scope set to? It might be that the metrics are collected against a different object (perhaps higher or lower in the SCOM object hierarchy) then that of your page scope.
My page scope is set to a single network device. It shows up as DEVICENAME Node. There are no other objects with that name for me to choose from so I can only assume it is the correct object to select.
Yes, I used the page scope simply to hide the name of the device so I wouldn’t have to black it out on my screenshot. I have tried specifying the network device using just the ‘List’ option.
Please do let me know what happens when you try to do this in your environment. I am really interested in knowing if you run into the same issue.
If you display as bar, and specify name in the scope - Display Name LIKE “%your interface”% do you should have more metrics displayed, but not searchable. At this point i cant say i am impressed with this MP
Great contribution. The problem for us is that were monitoring a few thousand network devices and all their interfaces with orion already. Adding these to SCOM isn’t actually an option, but for our core network it would be OK. All that aside, Solarwinds does this better, someone should have just helped them building the MP
For me, I want to leave all of the monitoring of network devices within SolarWinds. I don’t see the point of having SCOM monitor network devices directly if you already have SolarWinds in your environment.
As for what counters I am looking for…I’m looking for any performance counters. Per my original post, the only perfmon counter that I can see is “hardware info -status”. Yet in the SCOM console I can graph out other network device performance metrics such as CPULoad, BufferMiss, etc. So I know that data is in the SCOM data warehouse.
I will have to try to display as bar and see what I can search on. I don’t believe this is a problem with the Orion MP because if you go into the SCOM console and search through the SolarWinds section you do see performance graphs for different metrics as I showed in my top post. So the data is there…it’s just a matter of figuring out how to access that data so I can display it within a SquaredUp dashboard.