We have about 1700 Cisco switches that is monitored on SCOM.
I have grouped it per building, so basically a building have 1 distribution switch and a few access switches connected to the main distribution switch.
If the distribution switch is down, then obviously the whole building’s network is down, while if 1 or even a few access switches are down, then only a percentage is up and percentage is down.
Is this possible to create a SCOM/SquaredUP dashboard with this logic.
Example Scenario (1 Distribution + 8 Access switches)
Distribution down = 100% down = show red
2 Access switches down = 25% down = show darker green
We have done something similar with Exchange and Lync services.
The way we managed it was we put objects into a group and create dependancy monitors By doing this you can set the logic you mentioned above on each of your groups.
I'm not sure you can add all the logic variations you want mind you.
So in your case you could have the top level as the 'site' and two sub groups of 'switches' and 'distribution point'
Using our Exchange as an example we had 5 groups:
CAR
Edge
Hub
Mailbox
UMR
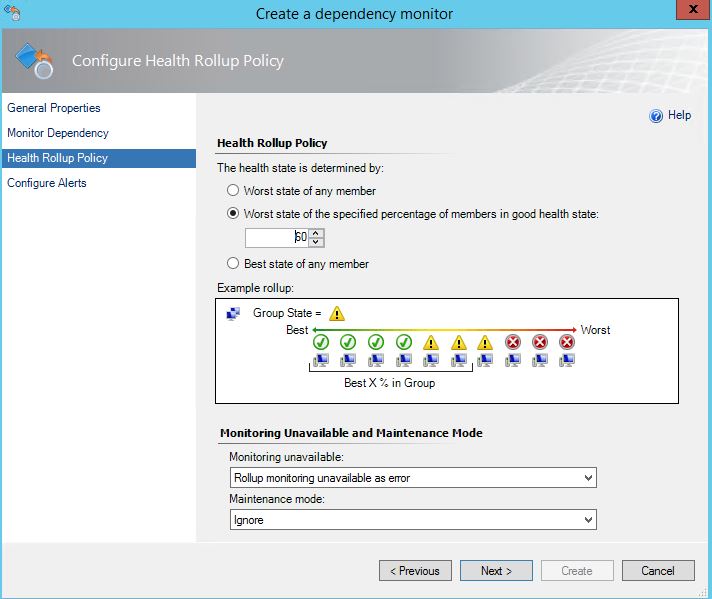
Each has all of their own ‘logics’ in the case of CAR it is 50% or more is RED and <50% is yellow
But Mailbox will go RED if anything is down, and as you can see from the example below the ‘EXCHANGE’ master group works on a worst case of the child roll ups.
As Matthaus and Jasper have said you only have three states in Squared Up. However if you looking to obtain a good diagram of your application you can download your SCOM DA diagram as a Visio diagram which you can then link to your data in Visio. Perhaps you could include your DA’s ID to get the health roll up of all your objects and then display the health state, as a workaround.