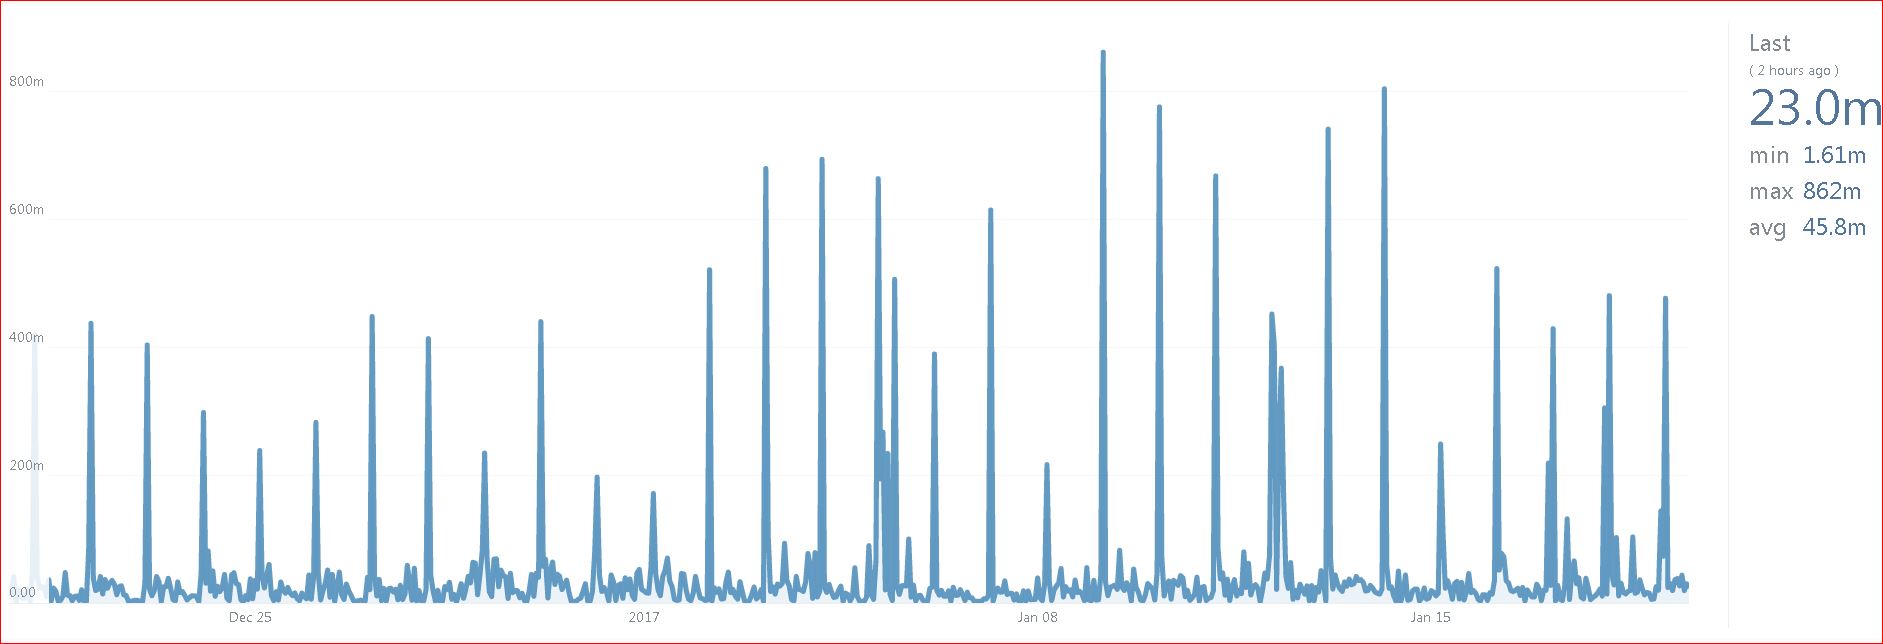
Trying to look into some performance spikes for a server on a particular drive.
I get the graph presented for what ever time range I want but when I hover mouse over a particular spike point or click on the graph, it does not display the exact Date or Time or m/s or KB/s for that point.
The next feature release v3.1, coming out at the end of January, will bring parity with v2. Once you’ve clicked on a performance graph to show the graph you’ve got in your image, it will then show you the data points when hovering over points on the line, as well as the ability to select and zoom in on a particular area.
The data points are pulled directly from SCOM, and in the Metric section of the the Performance Graph Tile settings you can choose the data resolution, which defaults to ‘raw’ but can be changed to hourly or daily.