Performance metrics generated by some custom rules look 'weird' in Squared Up

Hi,

We’re building some custom monitoring for an internal application and as part of this i’ve configured some rules to gather performance data for the processes that are executed to drive a number of Windows Services.

The odd thing is that the data looks fine in SCOM but when I look in Squared Up it looks like the counter data is being combined for some reason.

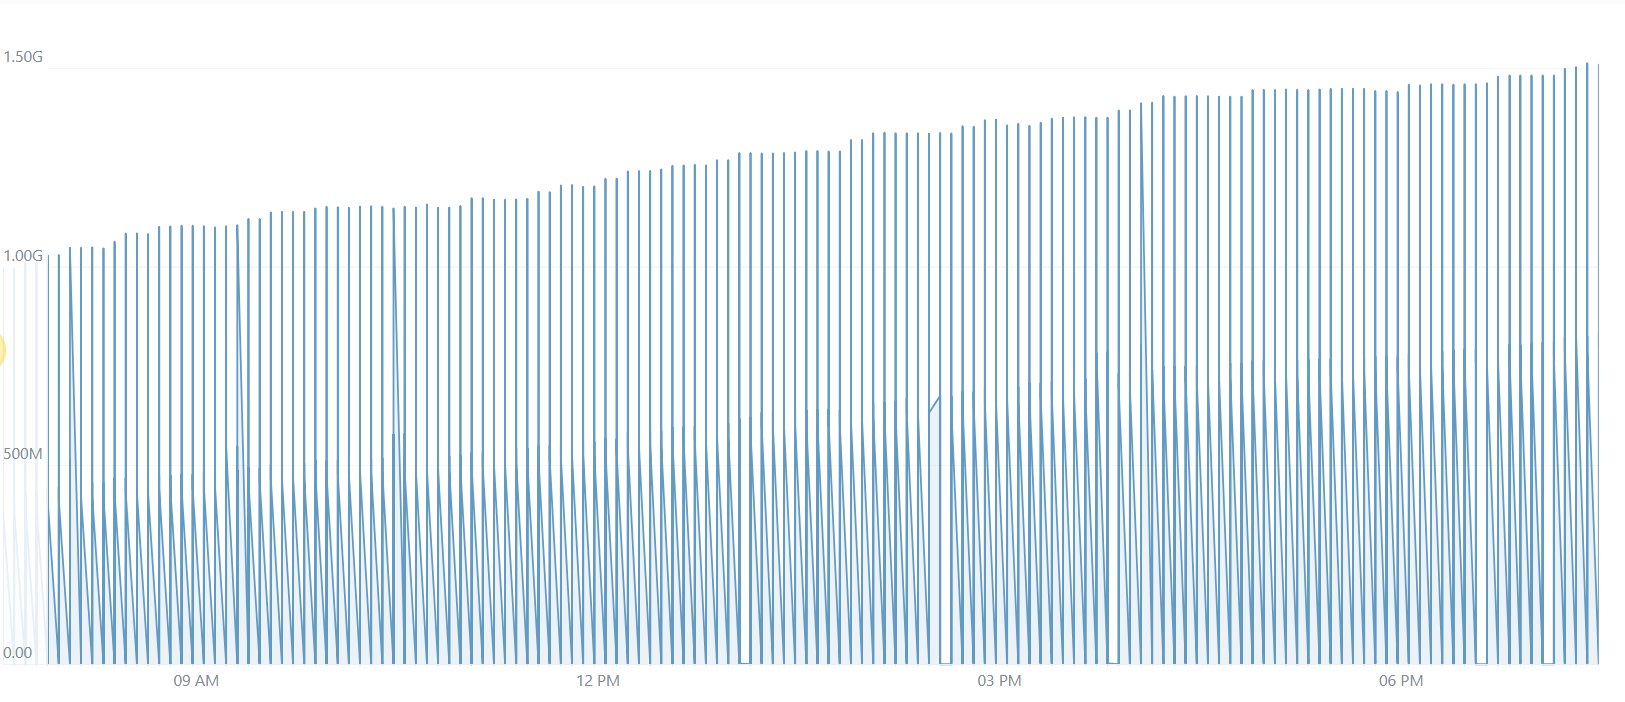
Here is an example of what I see for a single instance of the Service in SCOM console:

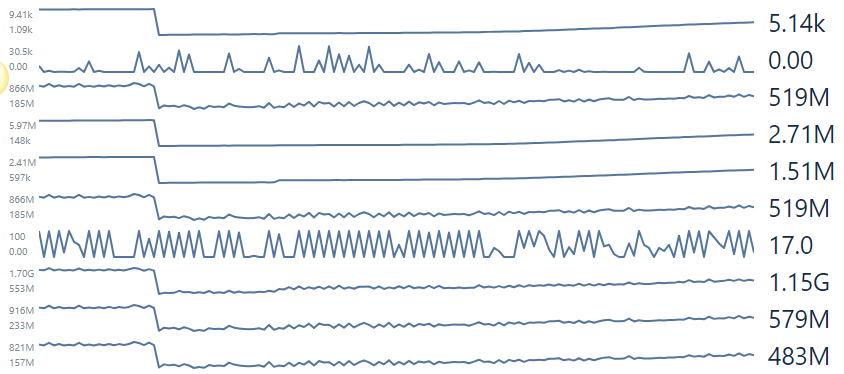
If I view the same object in Squared Up only a single performance counter is shown.

And the associated data looks totally different to what is shown in SCOM.

Does anyone have any clues on why this might be?

In terms of design the Management Pack uses a script which checks which Services exist on a Server before gathering the required metrics via WMI. This means that a single property bag is returned with all of the metrics; the idea being the it helps the monitoring to cook down.

The script is called by a probe which is then referenced by a custom data source. Finally i’ve used a custom condition detection module to select the relevent values from the property bag before mapping them to performance data so that they can go into the database and data warehouse.

I can post the XML if it helps diagnose the issue. There’s a good chance i’ve tripped up along the way as i’m still relatively new to SCOM.

Thanks

Pete

Thanks@Jelly .

I’ll have a look back over my MP. I can probably start by stripping back some of the rules i’ve got defined and perhaps configuring explicit rules for a couple of the counters.

I’ll report back when I have more of an idea as to what’s going on.

Hi

Jelly has hit the nail on the head and it is explained here:

worstpractice-a-call-for-scom-mp-developers-one-rule-one-counter

I have sample code that shows this in practice. As summary - if getdata.vbs returns three data streams then the following doesn’t work due to the above.

<Monitoring>
<Rules>
<Rule ID="Examples.Modules.Mod4.Perf.MultiplePropertyBagsBAD" Target="EG!Example.Groups.ApplicationServer" Enabled="true" ConfirmDelivery="false" Remotable="true" Priority="Normal" DiscardLevel="100">
<Category>PerformanceCollection</Category>
<DataSources>
<DataSource ID="DS" TypeID="Windows!Microsoft.Windows.TimedScript.PerformanceProvider">
<IntervalSeconds>600</IntervalSeconds>
<SyncTime />
<ScriptName>GetData.vbs</ScriptName>
<Arguments></Arguments>
<ScriptBody>$IncludeFileContent/HealthModel/RunTImedVBScriptCollectDataBAD/GetData.vbs$</ScriptBody>
<TimeoutSeconds>60</TimeoutSeconds>
<ObjectName>MyApp</ObjectName>
<CounterName>$Data/Property[@Name='CounterName']$</CounterName>
<InstanceName>$Target/Property[Type="System!System.Entity"]/DisplayName$</InstanceName>
<Value>$Data/Property[@Name='Value']$</Value>
</DataSource>
</DataSources>
<WriteActions>
<WriteAction ID="CollectToDB" TypeID="SC!Microsoft.SystemCenter.CollectPerformanceData" />
<WriteAction ID="CollectToDW" TypeID="MSDL!Microsoft.SystemCenter.DataWarehouse.PublishPerformanceData" />
</WriteActions>
</Rule>
</Rules>
</Monitoring>


You would need to ensure that you had a data source that was followed by a rule per performance data stream which included a condition detection to map the correct counters. E.g.

<TypeDefinitions>
<ModuleTypes>
<DataSourceModuleType Accessibility ="Internal" ID="RunVBScript">
<Configuration>
<xsd:element name="IntervalSeconds" type="xsd:integer" xmlns:xsd="http://www.w3.org/2001/XMLSchema" />
<xsd:element name="SyncTime" type="xsd:string" xmlns:xsd="http://www.w3.org/2001/XMLSchema" />
</Configuration>
<ModuleImplementation>
<Composite>
<MemberModules>

<DataSource TypeID="Windows!Microsoft.Windows.TimedScript.PropertyBagProvider" ID="DS1">
<IntervalSeconds>$Config/IntervalSeconds$</IntervalSeconds>

<SyncTime />
<ScriptName>GetDatav2.vbs</ScriptName>
<Arguments />
<ScriptBody>$IncludeFileContent/HealthModel/RunTImedVBScriptCollectDataGOOD/GetDatav2.vbs$</ScriptBody>
<SecureInput />
<TimeoutSeconds>60</TimeoutSeconds>
<EventPolicy />
</DataSource>

<!-- Note that this way of working means that we output perf data. We do not output property bag data
Multiple modules with a seperate Condition Detection would allow us to output property bag data from here
and still be able to use this for a rule and a monitor -->
<ConditionDetection TypeID="Perf!System.Performance.DataGenericMapper" ID="Mapper1">
<ObjectName>MyApp</ObjectName>
<CounterName>$Data/Property[@Name='CounterName']$</CounterName>
<InstanceName>$Target/Property[Type="System!System.Entity"]/DisplayName$</InstanceName>
<Value>$Data/Property[@Name='Value']$</Value>
</ConditionDetection>


</MemberModules>

<Composition>
<Node ID="Mapper1">
<Node ID="DS1" />
</Node>
</Composition>
</Composite>
</ModuleImplementation>
<OutputType>Perf!System.Performance.Data</OutputType>
</DataSourceModuleType>
</ModuleTypes>
</TypeDefinitions>

Then a Rule \ Condition Detection for each counter e.g. Test Counter 3 and Test Counter 4.

<Rule ID="Examples.Modules.Mod4.Perf.Counter3" Enabled="true" Target="EG!Example.ApplicationServer">
<Category>PerformanceCollection</Category>
<DataSources>
<DataSource ID="DS" TypeID="RunVBScript">
<IntervalSeconds>60</IntervalSeconds>
<SyncTime />
</DataSource>
</DataSources>
<ConditionDetection ID="Filter" TypeID="System!System.ExpressionFilter">
<Expression>
<SimpleExpression>
<ValueExpression>
<XPathQuery Type="String">CounterName</XPathQuery>
</ValueExpression>
<Operator>Equal</Operator> 
<ValueExpression>
<Value Type="String">Test Counter 3</Value>
</ValueExpression>
</SimpleExpression>
</Expression>
</ConditionDetection>
<WriteActions>
<WriteAction ID="DB" TypeID="SC!Microsoft.SystemCenter.CollectPerformanceData" />
<WriteAction ID="DW" TypeID="MSDL!Microsoft.SystemCenter.DataWarehouse.PublishPerformanceData" />
</WriteActions>
</Rule>
<Rule ID="Examples.Modules.Mod4.Perf.Counter4" Enabled="true" Target="EG!Example.ApplicationServer">
<Category>PerformanceCollection</Category>
<DataSources>
<DataSource ID="DS" TypeID="RunVBScript">
<IntervalSeconds>60</IntervalSeconds>
<SyncTime />
</DataSource>
</DataSources>
<ConditionDetection ID="Filter" TypeID="System!System.ExpressionFilter">
<Expression>
<SimpleExpression>
<ValueExpression>
<XPathQuery Type="String">CounterName</XPathQuery>
</ValueExpression>
<Operator>Equal</Operator>
<ValueExpression>
<Value Type="String">Test Counter 4</Value>
</ValueExpression>
</SimpleExpression>
</Expression>
</ConditionDetection>
<WriteActions>
<WriteAction ID="DB" TypeID="SC!Microsoft.SystemCenter.CollectPerformanceData" />
<WriteAction ID="DW" TypeID="MSDL!Microsoft.SystemCenter.DataWarehouse.PublishPerformanceData" />
</WriteActions>
</Rule>


Cheers

Graham

Hi Graham,

Ok, so I think I understand. But just to be entirely clear.

The code in the script currently does this:

				# create the property bag and return it (Percent CPU Time)
				$bag = $api.CreatePropertyBag()
				$bag.AddValue("Object","Process")
				$bag.AddValue("Instance",$serviceName)
				$bag.AddValue("Counter","% Processor Time")
				$bag.AddValue("Value",$performanceData.PercentProcessorTime)
				$bag

This code block repeats a number of times so that multiple metrics, but each in their own property bag. It is also embedded in a loop so we return multiple bags for each process that relates to a Windows Service.

In terms of the object we have:

Object: Always hard coded to be 'Process'

Instance: The name of the Windows Service that the process relates to

Counter: The name of the counter. As an example ‘% Process Time’ or ‘Handle Count’

Value: The actual performance metric


I presume what we’re talking about doing here is actually returning just a single property bag but making the names of the values unique so that they can co-exist in the same bag?

Any more examples that can be posted of the entire setup would be appreciated. It would be useful to see the whole thing from end to end - the script returning the data all the way back up to the associated rule definitions.

Thanks for the help thus far

Pete

Ok, i’m writing this here as a means to ‘think out loud’ and in the hope it might help others.

I’ve come to the conclusion that my script for gathering data was overly complex as it returned multiple property bags. This was done because you can’t have the same value with the same name in a bag.

The bag itself included the object name, the instance, the counter and the value. In fact this isn’t really necessary as it’s only the value I care about.

So, i’ve revisit the process and modified the script.

It now iterates through the services and for each metric it will place a single value into the property bag. The trick here is that the property name is a mixture of the Service Name and a static piece of content that denotes the metric. As an example, if you were running the script against two services named ‘Service1’ and ‘Service2’ the property bag would look something like this:

Service1Processor=76

Service1ThreadCount=12

Service1HandleCount=87

Service2Processor=45

Service2ThreadCount=5

Service2HandleCount=2


The rest of the values needed are actually provided in the condition detection module that is part of the rule and performs the mapping.

For example this one would be for Processor Utilisation:

        <ConditionDetection ID="Mapper" TypeID="Perf!System.Performance.DataGenericMapper">
          <ObjectName>Process</ObjectName>
          <CounterName>% Processor Usage</CounterName>
          <InstanceName>$Target/Property[Type="Service.UnicornGeneral"]/ServiceName$</InstanceName>
          <Value>$Data/Property[@Name='$Target/Property[Type="Service.UnicornGeneral"]/ServiceName$PercentProcessorTime']$</Value>
        </ConditionDetection>

The ObjectName and CounterName are just static strings but the instance name is taken from a property of the targettted object. The value name is also derived from this with a keyword appended. This means we just need a rule for each metric and each target Service.

This one, for example, would handle the rule for gathering the Unicorn Services Handle Count:

        <ConditionDetection ID="Mapper" TypeID="Perf!System.Performance.DataGenericMapper">
          <ObjectName>Process</ObjectName>
          <CounterName>Handle Count</CounterName>
          <InstanceName>$Target/Property[Type="Service.UnicornGeneral"]/ServiceName$</InstanceName>
          <Value>$Data/Property[@Name='$Target/Property[Type="Service.UnicornGeneral"]/ServiceName$HandleCount']$</Value>
        </ConditionDetection>

So yes, it means i’ll need quite a few rules. I think i’m gathering 6 metrics per Service and there’s 4 or 5 key services we’re monitoring; so that’s a little over 20 rules. But the content is largely the same so I can probably do a cut and paste and replace job.

I presume i’m now on the right track?

Pete

Hi Peter

I’ll see if I can dig something out at the weekend when I have a bit of time. the key point is that you can’t have multiple objects \ counter pairs in the same rule. And if I have read it correctly I think you are doing that.

Cheers

Graham

These look a lot more healthy. :-)

Hi Peter

Sorry I have not got back to you sooner; it has been a manic week at work and with the sun out in the UK I didn’t get around to looking at the computer too much :wink: I’m currently working on a series of log articles on SCOM Development so if you can wait I’ll look to post something up in a few weeks.

If you need anything sooner then post back and I’ll try to get around to it for you.

Cheers

Graham

I’m not an MP dev (just a general knowledge SCOM guy), but I can shed some light on the Squared Up side of things that might help. Squared Up pulls performance data out of the DW, whereas the SCOM console pulls it out of the OpsDB. There’s possibly something wrong with how you’re storing it in the DW, or it’s the single property bag that’s the issue. You could also try changing the Resolution on the tile (Raw/Hourly/Daily) to see if this is just the result of aggregation.

Hi,

One final thing.

Having read this: http://olegkapustin.com/2013/11/worstpractice-a-call-for-scom-mp-developers-one-rule-one-counter/

Would it not solve the issue if I changed the Object from just being ‘Process’ to the name of the ‘Service’?

This would maintain uniqueness I think?

Pete

Thanks Graham. I got the problem cracked now I think but i’d still really appreciate seeing your examples in case it approaches the issue in a better way.