Hi,
I see that my last question was a little ambiguous. What i meant was that I want to use the Donuts dashboard to show the Number of servers that have breached a Warning/Critical Threshold for Disk monitor.
To be clear, i am not looking for performance data for the disks.
Just to show that there are servers breaching disks thresholds or Number of servers that have gone off line etc.
I have managed to get these to show up on the Donuts dashboard by not entering anything in the Group and Class, see the image below.
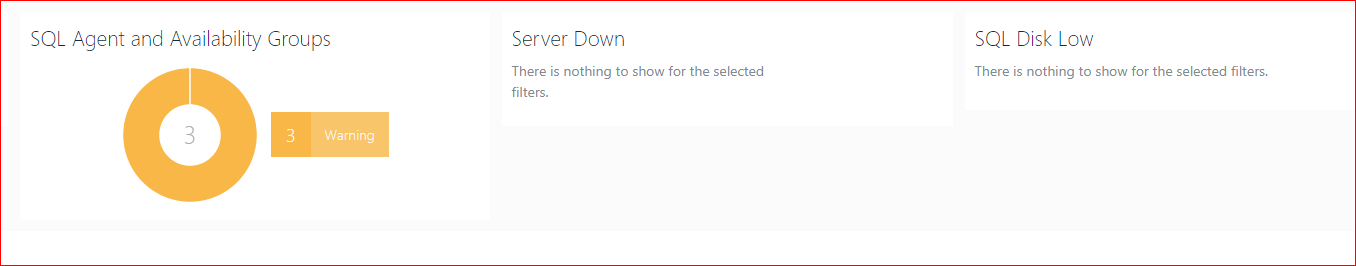
My question here is…what Table is this query running against?
What is the query being used here in this example?
How do i write a proper SQL query in the SQL Mgmt Studio to get this same Data to show up?
I have used this query in the Donuts dashboard, “Name LIKE ‘%Logical Disk Free Space%”,
I believe this is the WHERE statement.
What do i need to put in the SELECT statement and the rest of the query and target which table in the DB?