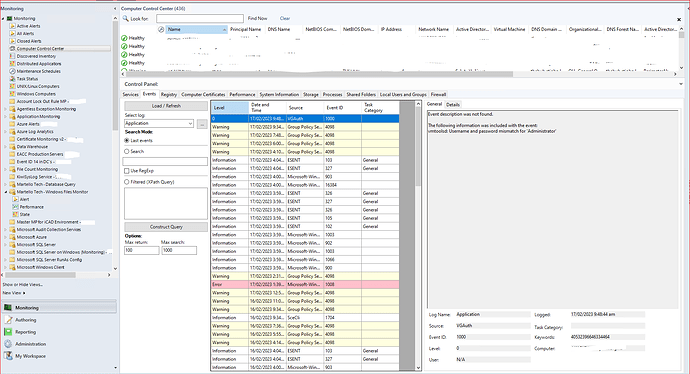
A Consolidated Server view in SCOM Console

I am looking for a Extended SCOM Console View in SCOM which will easily show me Monitoring Details for a Server/Node/Object I choose.

Is there such a view in SCOM?

Note:
Not looking for Performance view, which only shows graphical information
Not looking for Windows Computer details which are shown as below:
computer detail
Provides all Specification for the server but No Monitoring Details

Manager asked to show him what Monitors are running on a particular server, like what Services are being monitored, what are the Disk, CPU and Memory Thresholds on a server – i am scrambling to see any consolidated view that can provide me this info.

Please do not state to go and create a Dashboard view for this server as we could be asked to provide info on the fly for any server at anytime so creating this dashboard view for 1000’s of servers is not an efficient use of ones time.

I believe SCOM already has this Info “somewhere” even though it is very segregated and disjointed to search for this info in multiple places to collate it yourself—again not very efficient approach.

So a question for the Experts in this forum -

Can an MP be written or a SCOM Module be developed that can do the following:

  • Create such a view (start off with the basic Performance monitors and Custom monitors running on a Server/s)

  • Have the ability to Add or Remove which “Group” of Servers to show details for

  • Or should have ability to show servers Dynamically using …Expression or any other formula

Have used Kevin Holman’s “Extended Windows Class” method to discover Registry Values and use the Discovery View and it works wonders for our team to see the extra details:


Can something similar be created to Add the “Monitors and Rules” running on each Server in another Extended Windows Class type/view?

I understand that there could be 100’s or 1000’s of monitors or rules running on any server at anytime but that is not what I am after.

Just want to see the main things like performance monitor details and any rules and services monitor setup up for it.

For example, i am using Computer Control Center SCOM MP on from Developer Maxx Volk (Maximus Control Center Management Pack:
Day-to-day admin task automation with SCOM Console extension. – Max's blog on SCOM Authoring and more).

Provided all these info in just one view for any Server I choose:


Provides all information you need for a server in one place

Something like this developed to show the Monitoring details will be a Master Piece view for SCOM.

Anyone has worked on anything like this before or can make something like this?

Considering where you’ve asked this question, I assume you’ve heard of SquaredUp… right?

Perspectives in SquaredUp do pretty much exactly what you’re looking for with only a couple of minutes work to build the view you want.

To add to Pulp’s comment, you don’t need to do this per server either. Perspectives allow you to build views against classes. In this case, the Windows Computer class would be your best bet, as the perspective would be visible on all computer objects.

You can then run SQL queries, PowerShell scripts, or just use the native tiles, to showcase information for the object you’re looking at. SQL or PowerShell would use a mustache property to dynamically query for the object you are viewing at that moment in time.

For example, use the Monitors tile to show all monitors (grey are not enabled and can be filtered out) for a computer object and its children, using the Custom scoping:

image

Drilling into the monitors will show their configuration too, though if you wanted to show overrides, a PowerShell script or SQL query will give you more detail.

The out-of-the-box Performance perspective shows all enabled performance rules for an object and its children:

In short - Doing this in the SCOM console isn’t simple and it definitely isn’t user-friendly for non-SCOM. In SquaredUp, users would simply need to search for the server and look at the perspectives to get the information they require.

1 Like

We are a not for profit org and it is increasingly difficult to justify purchase of a third party tool to just show information from SCOM.
I have used SquaredUp before when it was free as a Community Edition and loved it.
Reason I have posted it here is to get insights from the wider SCOM and SCOM powershell community to see if and how can this be achieved from the SCOM console itself.
It is a simple question that one can ask “what monitors have we setup on my server…what are the thresholds being monitored on my Servers”.
Do not mistake this question for “what are ALL the Monitors and Rules SCOM is running on my server” or “what performance metrics are being monitored”.
Just want to know what “we” have setup like what custom thresholds for Disk, Memory, CPU and what Custom Services are being monitored etc.
Its a simple query yet SCOM has no ability to show this quickly.
For a tool that has been around for more than a decade, surely people would have asked this question and the fact that it still can not show us this detail is surprisingly disappointing.
i have used five monitoring tools before and all have the ability show what is being setup with what thresholds in one view in the same tool without the need of added expenses and adding third party tools.
I believe this feature should be built inside the tool itself.

Lets start from the basic:
“Is there a way to show “User Defined / Custom” (or Default) Thresholds set on a chosen Object on a chosen Server?”
Simple Performance Objects like the following:
CPU - % Usage
Warning Threshold =
Critical Threshold =
Sample =

Memory - Available Memory (Mbytes)
Warning Threshold =
Critical Threshold =
Sample =
Disk Free Space - Mbytes
Warning Threshold =
Critical Threshold =
Sample =
What "User Defined / Custom” Services/Processors have been setup?
F.e:
MDT.exe service from a Mobile Data Terminal application running on that Server
Paging .exe that runs Paging Service on that server etc.

While I say this question is simple (for other monitoring tools), it may not be simple for SCOM due to its limitations by Design.
But the question is still valid and should have a solution.

Brainstorming here:
(I could be wrong so correct me if I am)
All Custom Thresholds are written to a Custom MP (Best Practice)>

  • so lets say we choose a C: drive for Server “x”.
    Assuming it has custom thresholds set, these would be written in the Custom MP. (Let’s make it interesting, we didn’t create the Threshold ourselves so we do not know the details of the custom MP.)
  • now how do we get scom to identify where the Thresholds for Server “x” is written/stored.
    Once identified, we just need a little Powershell / SQL kung fu to pull out the relevant data.
    Then it should be rinse and repeat for any other Object.
    Is this logic correct?
    Further more to this -
  • what if an Object in Server “y” does not have any “Custom/User Defined Thresholds” setup but is still using “Default Thresholds” from the Default MP.
    Again - how do we tell SCOM to identify this scenario, choose the correct MP and pull data from the correct destination.

Further more to this -
once the Solution to the above is reached, we should be able to build the script further to accommodate Targeting a specified Group of Windows Servers.
Have this setup as a Report…to run on monthly basis and put forward to Management and wider IT Team to discuss the current thresholds set on critical application servers and if there is a need to adjust.

I still remember a decade ago when I started with SCOM and was asked about the same question. Unfortunately, that I know of, there’s no easy way to get that. Closest I would get is the Export-SCOMEffectiveMonitoringConfiguration cmdlet, but personally, never got anywhere with it.

SCOM is a VERY powerful tool, but unfortunately, also VERY complex (some will say too complex). It will take some time to adjust. On my path, I read the Unleashed book, but my real training came from the MP Authoring course on (now dead) MVA. Videos are still on Channel9. Videos are about 28 hours total, so yes, prepare for a long ramp-up, but the benefits afterwards… Whooweeeee

Good Luck!

Indeed the OPs question is difficult to answer. As for the OOTB cmdlet (from the Operations Manager posh module), Export-SCOMEffectiveMonitoringConfiguration, it is limited in scope and output. Last time I checked, it didn’t include all object instances of multi-instance classes (like disks or SQL agent jobs), it would only include the first instance found on the agent, and the report columns are minimal in quantity and usefulness. … which is why I wrote this: Export-SCOMEffectiveMonitoringConfigurationReport which is available in the SCOMHelper posh module (which can be auto-delivered to your mgmt servers via the SCOMHelper management pack). Report output includes complete workflow info for ALL contained objects and a generous number of columns and output format options.
The tricky part is first identifying the correct object instance to feed into the function. I highly recommend studying the workflow target class taxonomy to make sure that your selected object falls within the same family tree. Example: don’t feed a “Microsoft.Windows.Server.Computer” object instance into the function and expect to see workflows that target class type: “Microsoft.Windows.Server.6.2.NetworkAdapter” as they are not in the same family line. See attached graph (generated with New-SCOMClassGraph, also in the SCOMHelper module).

Here’s an external link to the graph since attachments appears so tiny in this reply box.