You may sometimes encounter situations where you attempt to create a line graph, only to see a “Missing X-Axis Column” error, despite having a date column.

Alright, now that you know the issue is due to the data type, you can go ahead and change it in the Columns section of your tile configuration.

But when you try to change the string to date Type, the value disappears!

This issue arises because the date is not in ISO 8601 format. Date strings need to follow the format (yyyy-MM-dd HH:mm).
To fix this, click on the downward arrow to expand the date section. Here, you can enter the format that corresponds to your input date. For instance, if your date is in the format yy.MM.dd, you would input that.
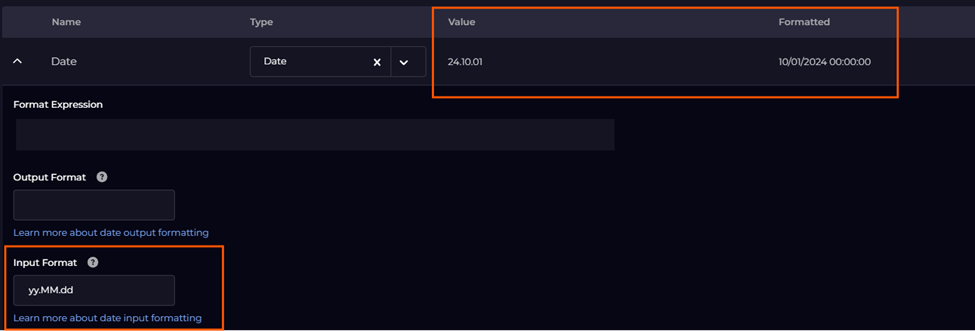
Once you’ve done this, you should see the date formatted correctly. At this point, you can choose to keep it as is or adjust it to your desired format.
In my case, I prefer not to include the timestamp, so I will use an output format to eliminate it.

Once you’ve done that, you should be all set!