How to create an Availability Report like the one that is on the demo.squaredup.com page.

On the Squared Up Demo site, if you go to Applications/Availability Report is shows a nice widget with History, Current Status, 24h SLA, 7d SLA, 1m SLA.

How would I create that same data but using our entire Windows Server environment? I’ve been tasked with creating a Health, Availability, & Performance dashboard for all of our servers that our Executives can go look at.

1 Like

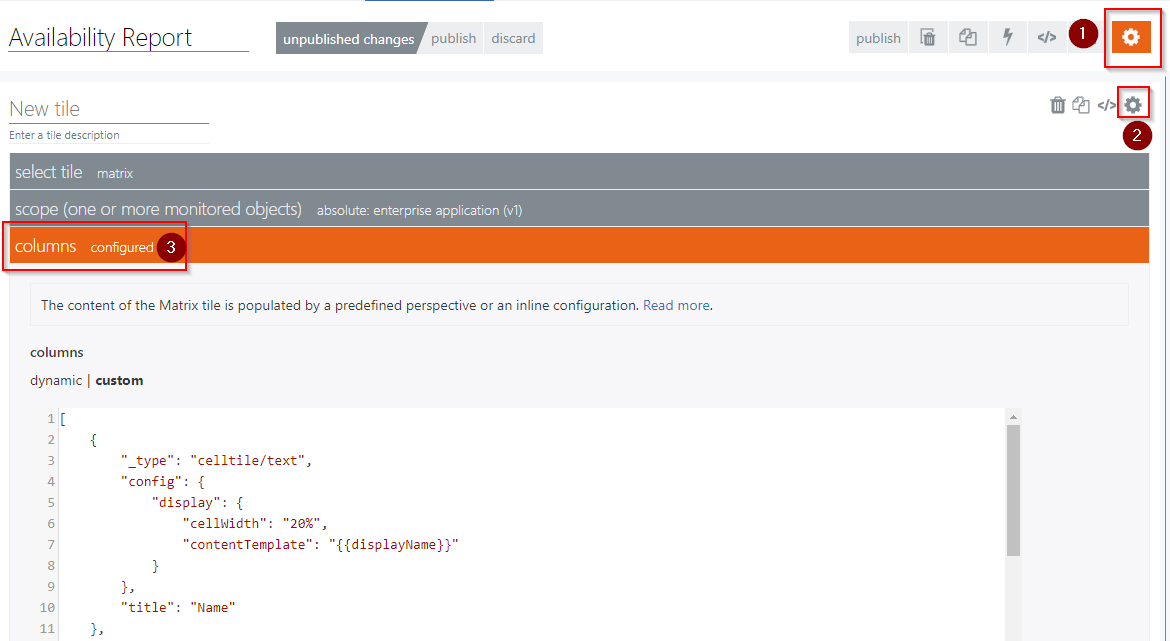
This view uses the Matrix tile and you can actually grab the json from your own instance (assuming you have an EAM license or a trial) and I've placed some details below.

I will add though, that this against the Windows Server class will only show you availability, not performance, as this is what the SLO targets (how to check config of SLO: https://support.squaredup.com/v4/Reference/Procedures/HowToCheckTheConfigurationOfAServiceLevelObjectiveInScom/).

You would need to create your own SLO in SCOM to track the other categories, which you would then need to break out into their own matrix tiles. This is not typically something an exec would want to see (too much information).

Create an SLO in SCOM: https://support.squaredup.com/v4/Reference/Procedures/HowToCreateAServiceLevelObjectiveInScom/

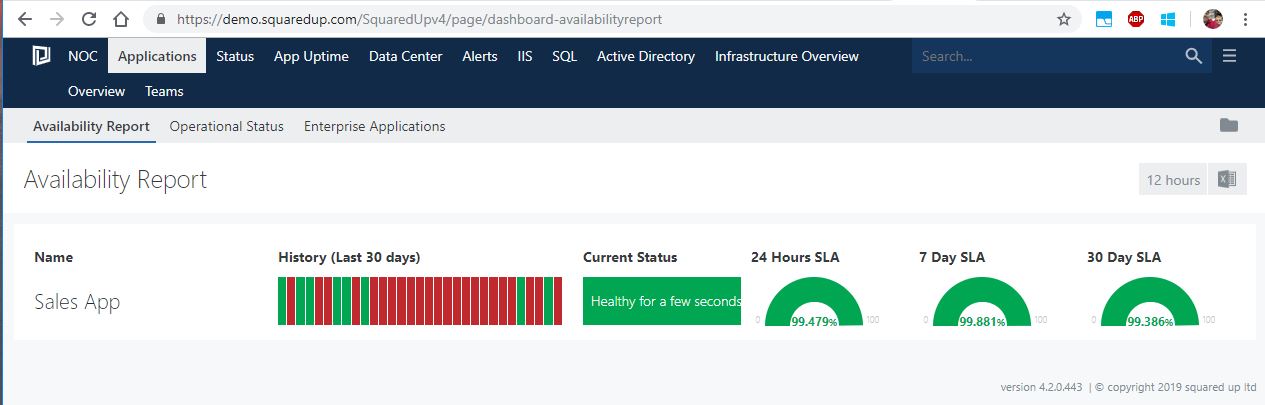
This sort of dashboard is best suited to applications, rather than something as broad as the server class.

The dashboard itself can be found on the navigation bar > Applications > Availability Report, or by searching in the global search box for the dashboard name.

Alternatively, I’ve placed the json below:

[
	{
		"_type": "celltile/text",
		"config": {
			"display": {
				"cellWidth": "20%",
				"contentTemplate": "{{displayName}}"
			}
		},
		"title": "Name"
	},
	{
		"_type": "celltile/timeseriesblocks",
		"config": {
			"display": {
				"cellWidth": "25%",
				"fullWidth": true
			},
			"source": {
				"monitorIds": [
					"e3ab86a1-34fa-35b5-b864-da4db993c0f5"
				],
				"timeframe": {
					"range": "Last30Days",
					"type": "fixed"
				}
			}
		},
		"title": "History (Last 30 days)"
	},
	{
		"_type": "celltile/status-block",
		"config": {
			"display": {
				"labelTemplate": "<div style='font-size:1rem'>{{#if healthState === 'Success'}}Healthy{{elseif healthState === 'Uninitialized'}}No health{{else}}Unhealthy{{/if}} <core-timeago withoutSuffix='true' value='{{stateLastModified}}' prefix='true' /></div>"
			}
		},
		"title": "Current Status"
	},
	{
		"_type": "celltile/sla",
		"config": {
			"source": {
				"sloId": "b2ef6aec-bd2e-4740-aa7e-acbf3e7ae913",
				"timeframe": {
					"range": "Last24Hours",
					"type": "fixed"
				}
			}
		},
		"title": "24 Hours SLA"
	},
	{
		"_type": "celltile/sla",
		"config": {
			"source": {
				"sloId": "b2ef6aec-bd2e-4740-aa7e-acbf3e7ae913",
				"timeframe": {
					"range": "Last7Days",
					"type": "fixed"
				}
			}
		},
		"title": "7 Day SLA"
	},
	{
		"_type": "celltile/sla",
		"config": {
			"source": {
				"sloId": "b2ef6aec-bd2e-4740-aa7e-acbf3e7ae913",
				"timeframe": {
					"range": "Last30Days",
					"type": "fixed"
				}
			}
		},
		"title": "30 Day SLA"
	}
]
Matrix tile docs: https://support.squaredup.com/v4/Walkthroughs/Tiles/HowToUseTheMatrixTile/

Thanks for the quick response. I followed along with your steps and was able to create the Matrix tile and populate it with all of our servers.

However, it created a line for each server, is there a way to roll them all up in to just one line?

Here’s what I got back from my manager when I showed him the Matrix tile info with a line for each server.

“For the availability/downtime metric, it does not have to individualized. Just need to show uptime/availability %, downtime % (if possible) and trend cumulative across all servers.”

So if I can roll up all of the individual servers to one cumulative line that would work well.

The computer objects themselves don’t actually track downtime in SCOM. It’s the agent watchers in SCOM that do this (https://social.technet.microsoft.com/Forums/azure/en-US/a748e68c-41f9-41c2-90c8-b41a5e7ec670/availability-report-from-scom?forum=systemcenterrom) - Scope the tile to LIST SCOPE with the Microsoft.SystemCenter.AgentWatchersGroup added - One line that contains the agent watchers group which tracks availability. See https://docs.microsoft.com/en-us/system-center/scom/manage-agent-heartbeat-overview?view=sc-om-2019 for more info

Thanks again for answering my questions. Using the Microsoft.SystemCenter.AgentWatchersGroup worked, I now have one line but it’s showing 100% availability, even though I know that to be incorrect.

I created another widget using the Matrix tile and the custom formatting you gave me earlier and the History (Last 30 days) column shows an outage but the SLAs still show 100%.

I can’t post a picture inside this comment box to show you what I’m seeing. But maybe my SLAs aren’t configured correctly and that’s why they show 100%. For the Service Level Tracking wizard, when I do a search in the “Select a Target Class” tool, I don’t see the Microsoft.SystemCenter.AgentWatchersGroup to select it. So what class/group should I use in the wizard so that it adjusts the SLAs correctly?

This is an age-old SCOM argument: What constitutes “downtime”? The agent watcher group will only show outages when the computer is offline/agent off, not if you have any other kind of issue. You’re probably going to need to use the windows computer group, after configuring health rollup. When you create your SLO you can choose if “monitoring unavailable” counts as downtime - if you do this, it will include when the computer goes offline. Such an SLA will likely always be red unless you have a world-class environment or have very aggressively tuned your MPs.

“For the availability/downtime metric, it does not have to individualized. Just need to show uptime/availability %, downtime % (if possible) and trend cumulative across all servers.” - This often what people say they want, but the % value they are usually after is the % of computers that had availability issues during that timeframe. What SCOM instead tracks is the % of time that ALL computers were healthy, which is typically 0% in most orgs.

You can also use the SQL tile to query all computers, and find computers that had downtime in the timeframe, and use that as a percentage of all computers.