Hello all!
Following on from the great thread about Mustache examples for applying custom formatting I wanted to share how to manipulate Headers & Data values in your WebAPI tiles using similar techniques.
The use case is simple enough, the API you want to call accepts parameters that relate to the page timeframe on your dashboard. In the following example I am querying a Prometheus end point to get some metrics for a Kubernetes cluster hosted in AWS.
Steps
- Setup the API Provider for your data source
- Add Web API tile to your dashboard
- Configure the provider and HTTP mode to query the desired end point.
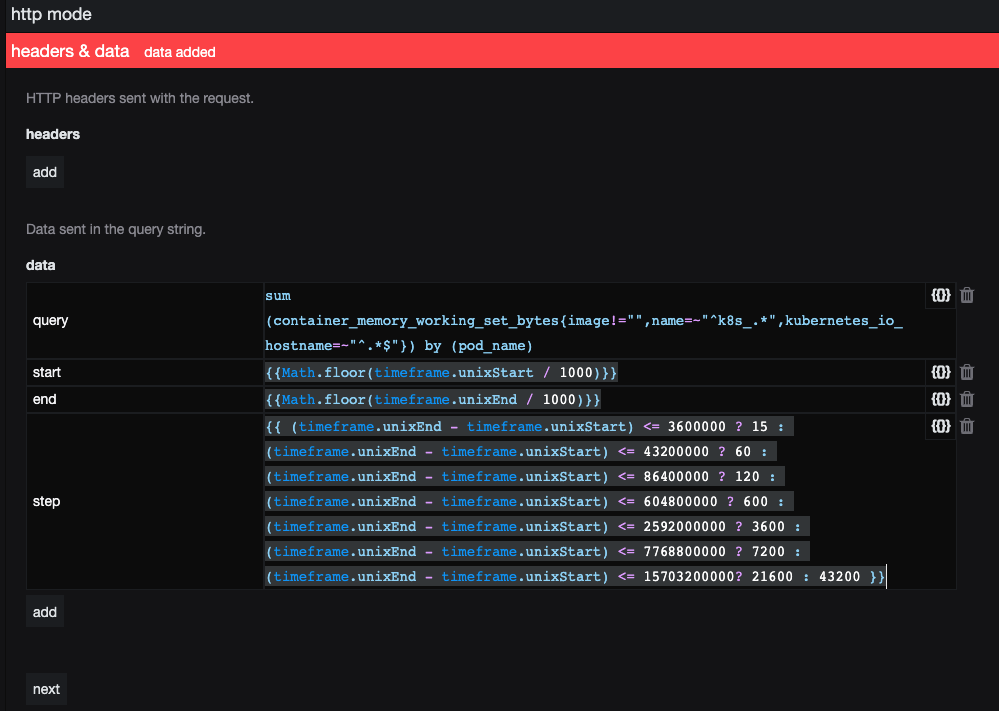
- In headers & data input the parameters of your API end point that control the timeframe aspects of the request.
Example: Prometheus timeframe configuration
Prometheus has 3 parameters we need to consider for page timeframes:
a) start - the start of the timestamp (in unix format)
b) end - the end of the timestamp (in unix format)
c) step - query resolution in number (in seconds)
Setting start and end in SquaredUp is easy, click on the mustache picker and choose {{Math.floor(timeframe.unixStart / 1000)}}and {{Math.floor(timeframe.unixEnd / 1000)}}. This will set the page timeframe on the dashboard into the API query.
Step is a little harder, since you do not want the API request to Prometheus too return too much data, the longer the time frame the higher the query resolution needs to be. i.e. for a timeframe of 1 hour, then 15 second step is good but for a 1 year timeframe that would return a 400 error from the Prometheus API, so we want a step of 12 hours or more!
The mustache picker is powerful, and can handle some simple JavaScipt, this is quite long because we’re specifying a step value for each page timeframe option (1 hour, 12 hours, 24 hours, 7 days, 30 days, 3 months, 7 months and 1 year):
{{ (timeframe.unixEnd - timeframe.unixStart) <= 3600000 ? 15 : (timeframe.unixEnd - timeframe.unixStart) <= 43200000 ? 60 : (timeframe.unixEnd - timeframe.unixStart) <= 86400000 ? 120 : (timeframe.unixEnd - timeframe.unixStart) <= 604800000 ? 600 : (timeframe.unixEnd - timeframe.unixStart) <= 2592000000 ? 3600 : (timeframe.unixEnd - timeframe.unixStart) <= 7768800000 ? 7200 : (timeframe.unixEnd - timeframe.unixStart) <= 15703200000? 21600 : 43200 }}
The JavaScript above is simply calculating the time difference between the start and end of the page timeframe, and if its less than or equal to a certain value (in miliseconds) then the steps value is set to an appropriate size.
Just like this:
And that’s almost it, simply finish configuring the tile:
- Response data panel input
data.result[0].valuesas the keypath. - Data mappings: timestamp
{{.[0]*1000}}and metrics{{.[1]}} - Add a label and you’re done!


Hope this tip is useful!