I have about 10 availability DAs with uptime in SLO. In Squared Up I have displayed these with the basic gauge tiled all around a page as seen below. I think there is some great room to make this "pretty" before I share the link with management. Does anyone have any ideas?

3 Likes

Is there a way to remove the spaces in between? Since these are tied to SLO I’m having to do these individually which is creating the separation as opposed to strictly Web Availability. 
I’d go for the status block tiles and then just use the gauges (hiding the icon etc.) below those. That works quite well as the block tiles are a nice chunk of green (hopefully no red!).
1 Like
Hello,
I may be a little late to the party here and I presume this your dashboard has already gone to management.
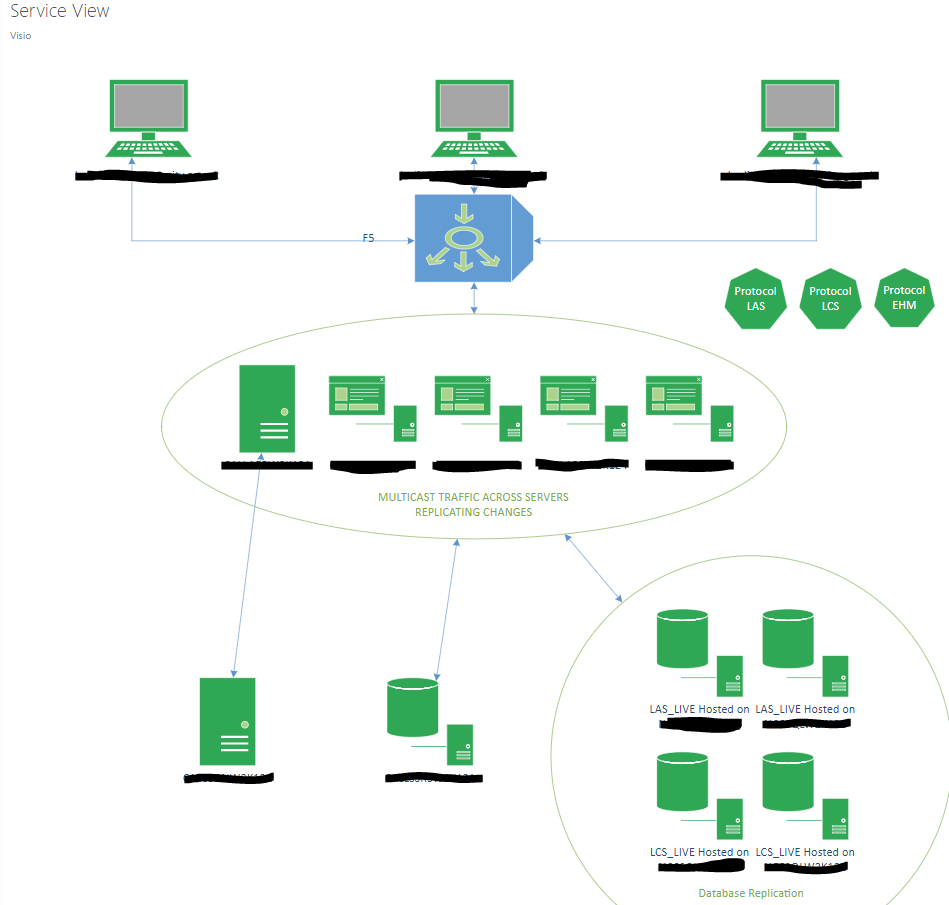
Have you tried using Visio to create your dashboard.
I have created for an application:-
That shows the the following
Website Availability
Service Availability
Server Availability
Database Replication Health
I have tried to attach an image but this hasn’t uploaded.
For a prettier dashboard though I think using the Visio tile is the best way forward provided all the things in the back has been done.
If you need any more info drop me a message.
Chris
2 Likes
Hey Chris. I’d love to see what you’ve done. One thing that it’s been a challenge to show is not only the app uptime gauges that seem to make sense like above but also being able to drill down and determine “Why” and explain the drops in %. Therefore, I’ve had to remove monitoring unavailable and monitoring disabled and then will have a separate page showing SCOM monitoring to report outages. I have a Visio tile for another page but not specifically for these uptime. They want to be able to scale from 12 hours to 3 months so I’m not sure how that would look on a Visio tile but I’ll check yours out. I’m open to some examples.
In fact, it’d be nice for Squared Up to have a community repository of dashboard examples that people can upload so we can get creative ideas. That seems to be very lacking so far.
Hello,
It seems to have loaded now.
This is just an application view that has been created within Visio; using a worst case monitor on the websites, and the services.
Well how do you track SLAs? I get this for detailed technical service availability. I have a Visio diagram that does show the list of applications with their logos and a checkbox whether all is well. However, for management they wanted a list of apps and SLA numbers that they can view up to the past quarter.
The challenge has been when you see the app uptime % drop tracking down the why as referenced above again. The Service Level Tracking report in SCOM gives you great availability detail but you can’t really see that in Squared Up.
Yes sir. That’s exactly what I need. I need the gages / apps / app descriptions … and then enough data to answer the question “What happened to cause the changes below 99%?”
Also, it’s kind of a pain because I can’t do a custom date range to calculate uptime. It’s always based on now. i.e. "Last 1 hour, 12 hours, " etc from now. If I want to do a Dec 1 - Dec 31 I’m kinda screwed and have to go to SCOM reporting and not Squared Up.
Also, to get alert context for state changes I have to go to SCOM because Squared Up doesn’t give that info. There is so much lacking in Squared Up from an App Health / SLA reporting perspective.
The Inline SLA gauge is much cleaner, but other than that, there’s not really anything more you can do with it, other than removing parts of the visualization (gauge, status etc.).
It’s a bug! I reported it a while ago, not sure if it’s fixed yet.
Oh ok so am I right in presuming that you want a full on dashboard, to display all the information needed for management?
@rolltide Would you mind letting me know how you are calculating Exchange uptime? We are trying to figure this out currently. Thanks!
For Exchange, it’s such a broad question since we have mail flow, access, and other services. I just used the internal cmdlets that test against itself. Also, you could explore something like this.