You might be trying to create a line graph but instead of line graph, did you get a confusing message about a “Missing Y-Axis Column”?

You might see all the right columns in your data section: a date time column and another column with values. But still, you get the above message. Because the values (Y-axis) column might not have the kind of number the graph needs. It might have string data type instead of number data type.
Here is how to fix it:
- From the data section, hover over the column name that should have values for Y-axis.

- Look for the shape and check what it displays. If it says shape_string, then you would need to change it to shape_number.

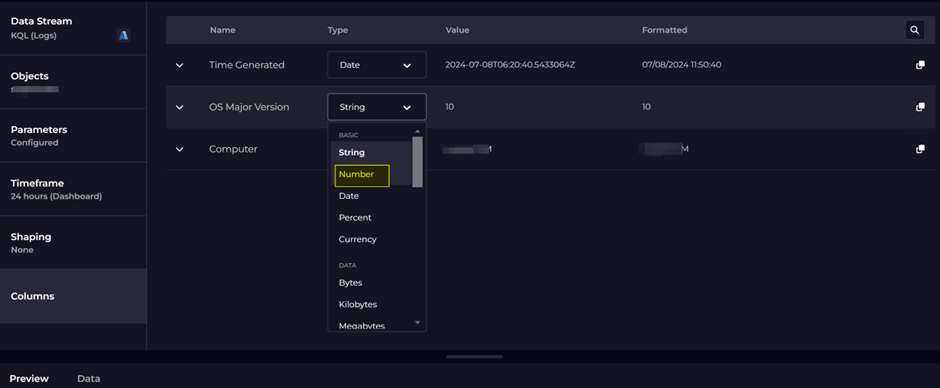
- Go to the tile configuration pane and find the columns section at bottom.

- Change the data type from String to Number.
With this change in data type, your line graph should be ready.
Cheers!