Hello everyone,
is it possible to display host performance data in the alert tile?
E.g. for an low memory alert the actual free mb of the host?
Or for an low free disk space alert the actual free mb of the disk?
Thanks
Daniel
Hello everyone,
is it possible to display host performance data in the alert tile?
E.g. for an low memory alert the actual free mb of the host?
Or for an low free disk space alert the actual free mb of the disk?
Thanks
Daniel
In version 3 you can create custom perspectives for alerts. This will allow you to display contextual performance information based on the object that has generated an alert.
More info on perspectives:
https://support.squaredup.com/v3/Reference/Features/WhatIsAPerspective
Thanks for your quick reply!
My question was a bit ambiguous, so I updated the wording.
The question is related to the alert tile (the alert overview), not the alert detail view - sorry.
Whoops! That’s okay, either answer should help people.
In short, no, you cannot do this. You can add additional columns to the alert tile, however, there’s no way to include the latest value (that I’m aware of) that triggered the alert.
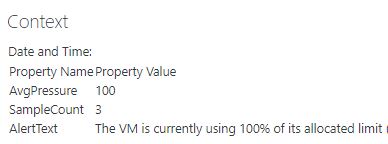
You can see what value caused the issue via the Context tile on the alert page. Though, this does require drilling into the alert itself:
Perhaps this is something to send to Support as a feature request?
Thanks again!
I already configured a command channel with a script to copy the alert text into the alert custom field 1 added to the alert tile. But this is a fixed value caused the alert.
A way to display (contextual) live performance data would be great …
This is the alert tile, right?
Is there any way to get this tile extended with live performance data? To achieve an overview of the actual values without klicking / using the alert detail view? No way, right?
Hi
You need to do a diagnostic task when the alert (only from monitoris) is triggered. This way you can run a script/wmi to pull in the information in the alert.
See
https://technet.microsoft.com/en-us/library/hh551141(v=sc.12).aspx
You can do this using a perspective on an alert. It will show on a specific alert, contextually showing data for the object that triggered. As it’s just another perspective, you can basically then add in any tile you want. This can be performance data, Data on Demand (https://www.youtube.com/watch?v=9d17DYiqLUo&t=1s), or even just a simple HTML tile with remediation steps.
Thanks again and again.
I updated my reply above.
I don’t want to use an alert detail view / alert perspective, because I want to achieve an overview of all alerts with live performance data without clicking (for an Operations / NOC screen).
