Pull data from csv with PowerShell tile

I’ve got a script that saves upload and download times of a file to our corporate filestore and records the time in milliseconds in a csv file. After a lot of mucking about, I’ve got a PowerShell line graph tile in SquaredUp to display the results, but it seems to only be showing the last value, not all values in the csv.

Here’s the script for the tile:

#SquaredUp tile
$data = Import-Csv -LiteralPath \\prs-data\scom\filemon\report.csv -Delimiter ',' -Header 'DateTime','Uploadtime','Downloadtime'
$data | Select @{
    Name = "DateTime";
    Expression = {[datetime]::ParseExact($_.DateTime, 'dd-MM-yyyy HH:mm:ss', $null)}
    },
@{
    Name = "UploadTime";
    Expression = {[int]::Parse($_.Uploadtime)}
},
@{
    Name = "DownloadTime";
    Expression = {[int]::Parse($_.Downloadtime)}
}

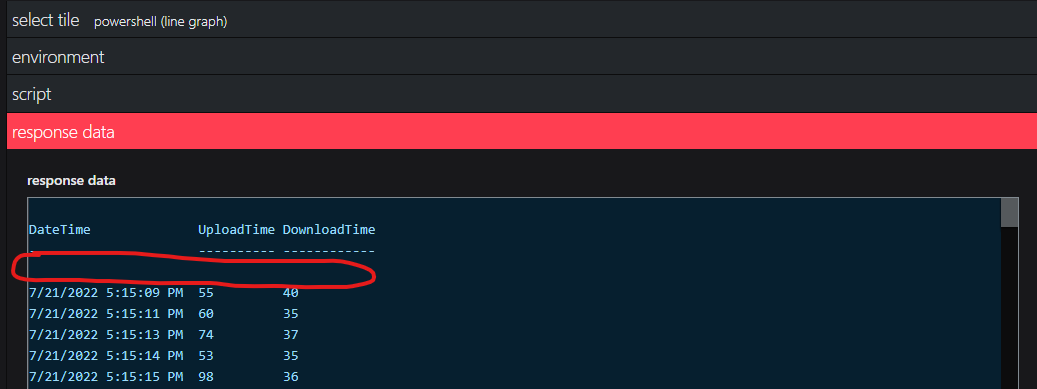
The response data is as expected:
DateTime UploadTime DownloadTime


21/07/2022 17:15:09 55 40
21/07/2022 17:15:11 60 35
21/07/2022 17:15:13 74 37
21/07/2022 17:15:14 53 35
21/07/2022 17:15:15 98 36
21/07/2022 17:43:25 144 38
21/07/2022 17:44:40 98 42
21/07/2022 17:52:49 761 39
21/07/2022 18:02:49 703 96
21/07/2022 18:12:49 445 39
21/07/2022 18:22:49 444 40
21/07/2022 18:32:49 323 38

But the graph looks like this:

What am I doing wrong, is it something with page timeframe?

Hello Peter,

It took a little time to figure this out, but it wasn’t anything related to page timeframe.

After some trial and error, it appears that the culprit is the -header parameter of the Import-CSV command.

More specifically, when the source data (in your case, a CSV) has column headings AND the -header parameter, a new row is created that contains the column headings.

Ironically, because the original code is being “strict” with its data types (a sign of a good programmer), the data is “missing.”

This is how it shows up in SquaredUp, you can see the empty row:

But if you change the code to not be strict (in the console, not SquaredUp), it shows up like this:

image

Another irony, if you remove the “strictness” in SquaredUp, the tile refuses to render because there is text in your value field!

But, with all of that being said, that blank row is not being properly handled by SquaredUp because instead of ignoring it, it renders a graph that is incorrect (or malformed?).

In any case, here is your original script, with the offending code removed:

#SquaredUp tile
$data = Import-Csv -LiteralPath C:\SquaredUp\report.csv -Delimiter ','
$data | Select-Object @{
    Name = "DateTime";
    Expression = {[datetime]::ParseExact($_.DateTime, 'dd-MM-yyyy HH:mm:ss', $null)}
    },
@{
    Name = "UploadTime";
    Expression = {[int]$_.Uploadtime}
},
@{
    Name = "DownloadTime";
    Expression = {[int]$_.Downloadtime}
}

I hope that help!

Cheers!
-Shawn

1 Like