Has anyone used the Web api tile (donut) for displaying something like diskspace?
I have my API output
 {
	"data": [
		{
			"type": "WinLocal",
			"id": "ec959a1e-5253-4525-b644-15ab66e3c3bd",
			"name": "CD-LAB-REPO1",
			"description": "Created by CD-LAB-VEEAM1\\Administrator at 16/02/2021 14:12.",
			"hostId": "6745a759-2205-4cd2-b172-8ec8f7e60ef8",
			"hostName": "CD-LAB-VEEAM1",
			"path": "R:\\Backups_Primary",
			"capacityGB": 1862.9,
			"freeGB": 1097,
			"usedSpaceGB": 0
		}
	],
	"pagination": {
		"total": 1,
		"count": 1,
		"skip": 0,
		"limit": 200
	}
}
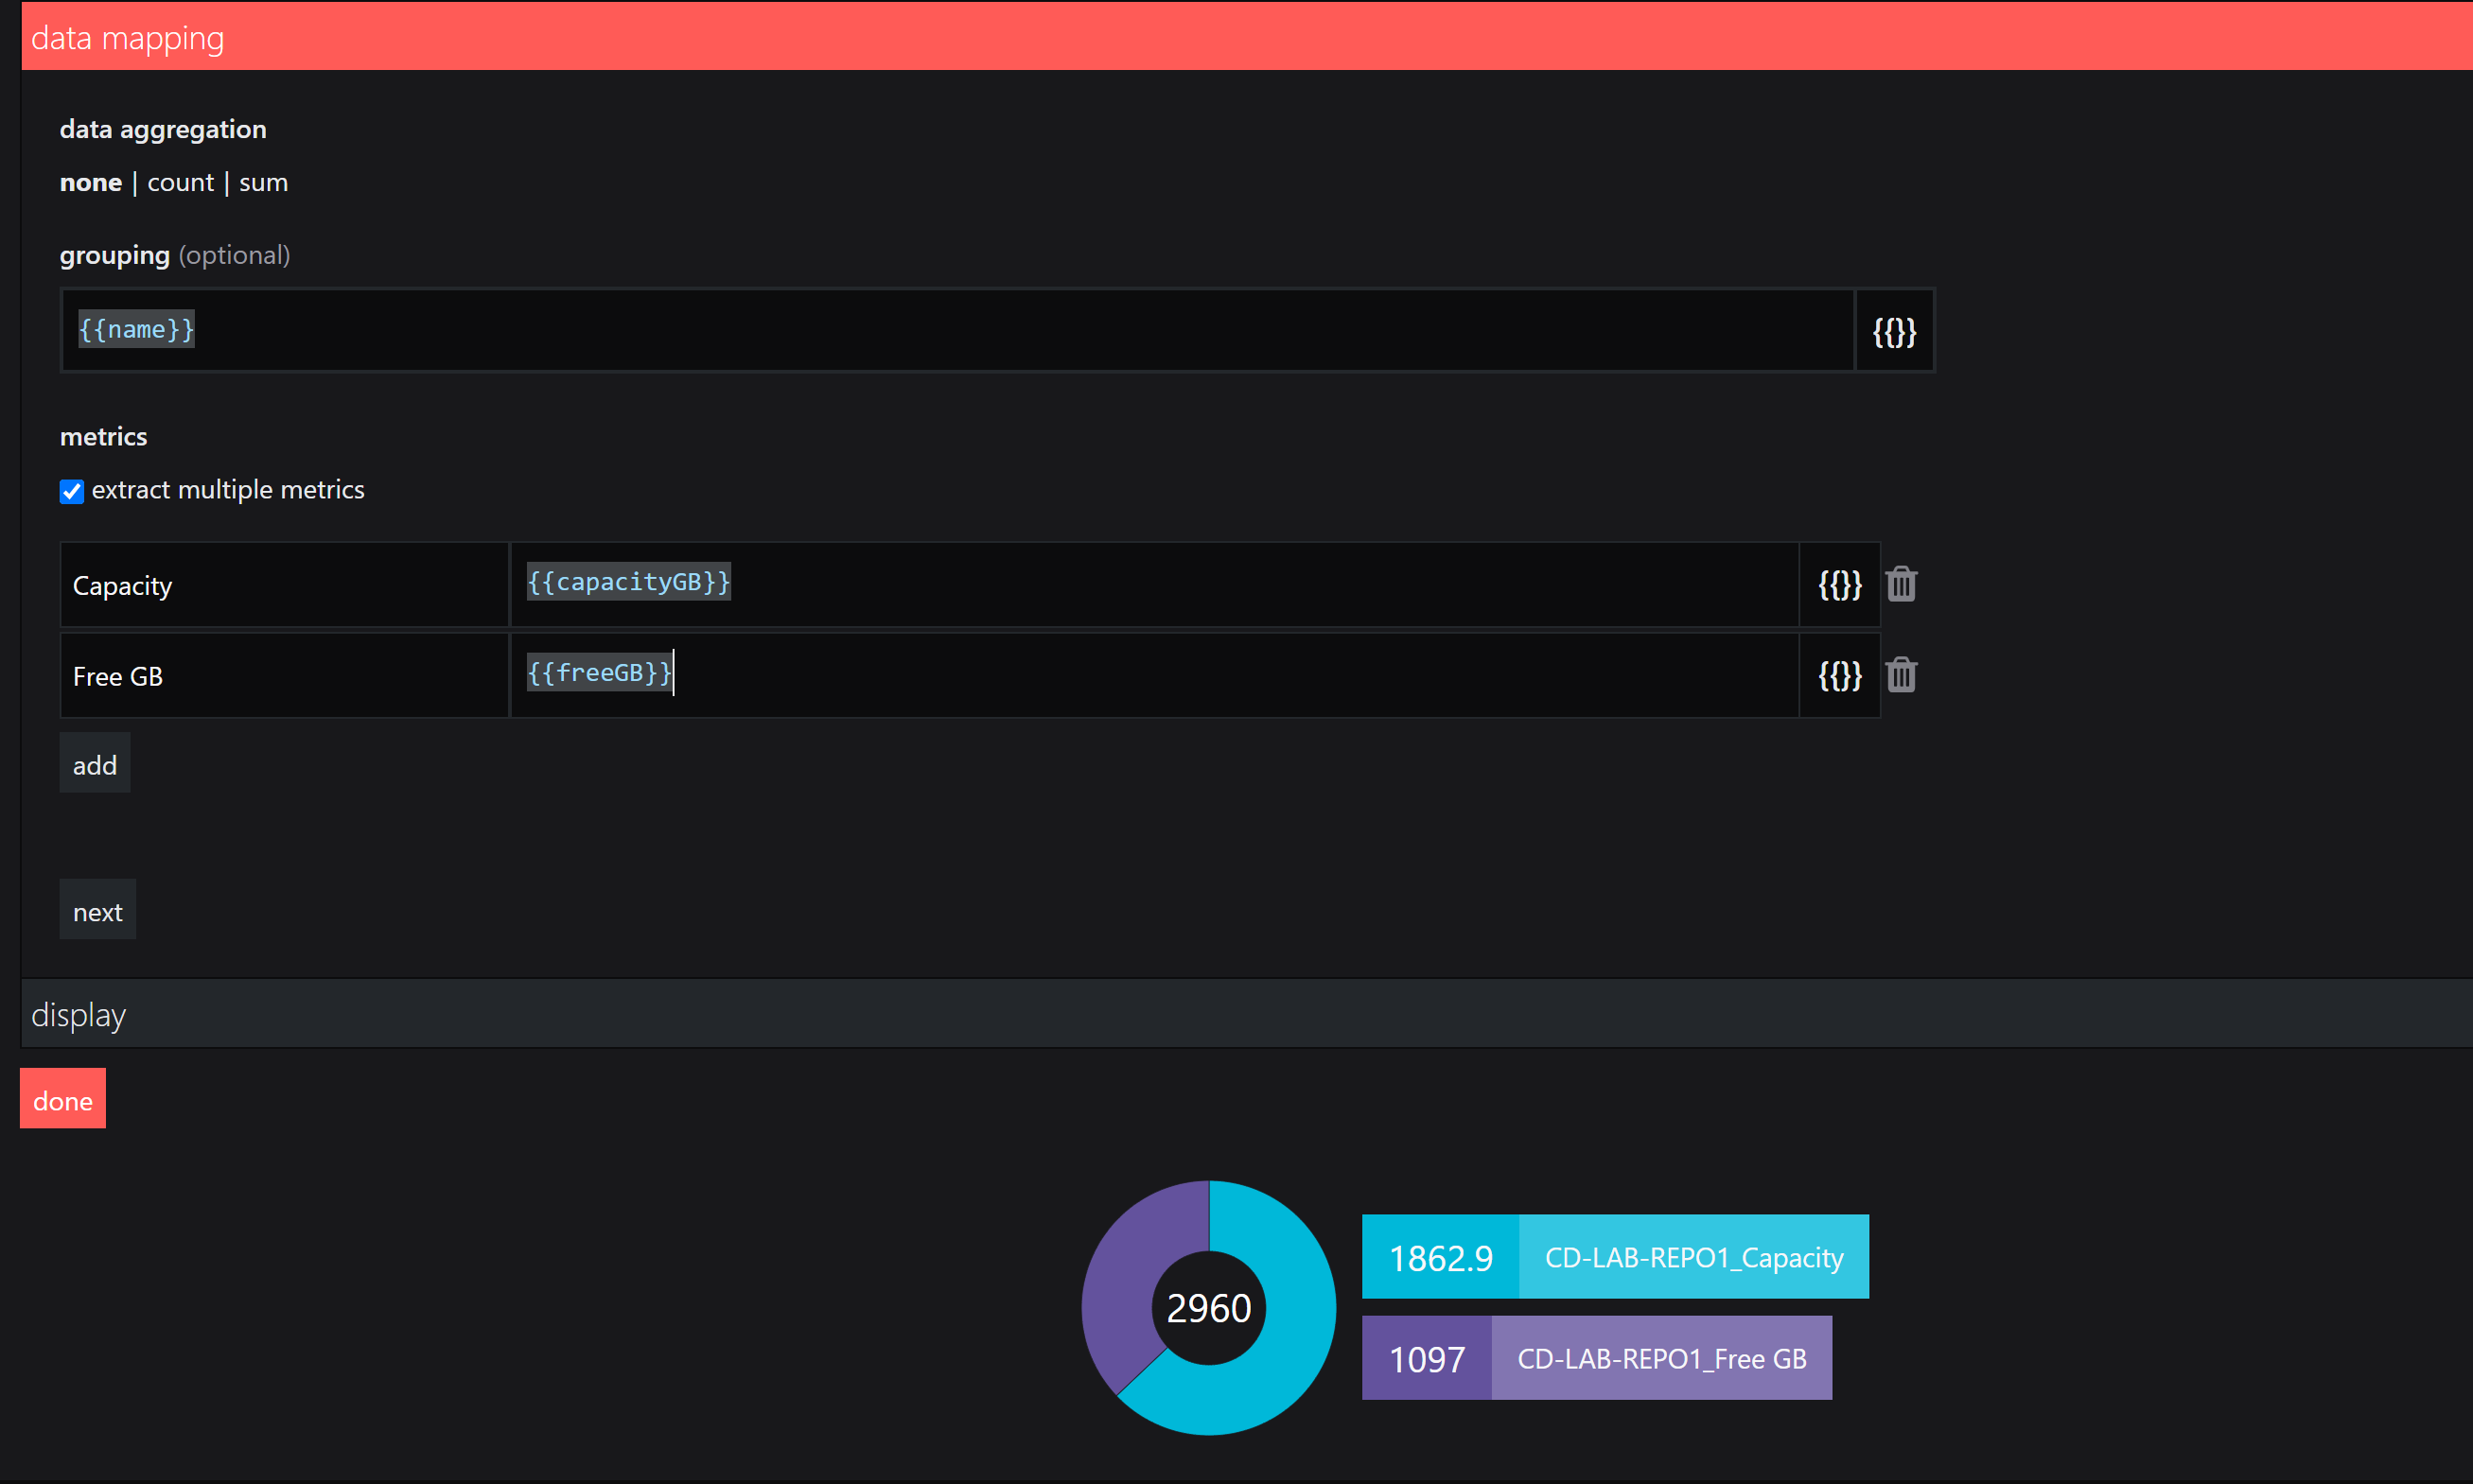
And would like to show both freeGB and usedSpaceGB in one donut chart, but when I select multiple metrics to extract I get the error message
A value column from your result set has not been selected
.
Anyone have an pointers? Someone must have used this for similar in the past