Hey everyone,
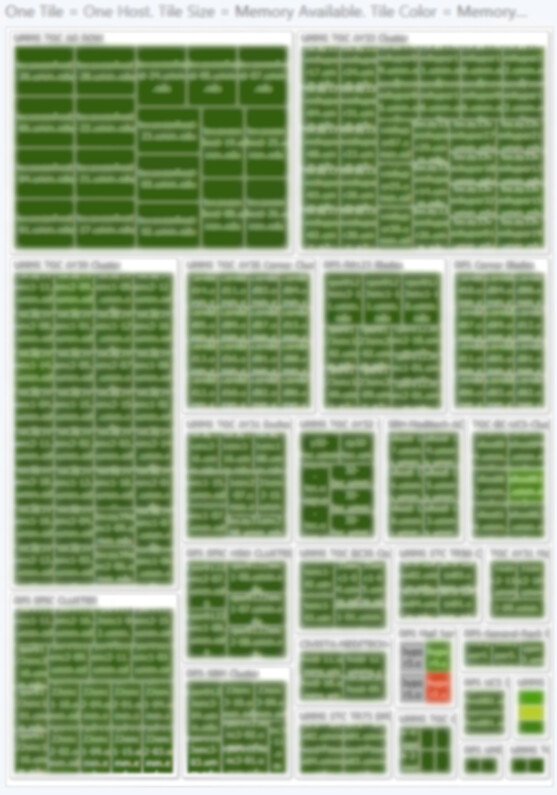
Anyone have any idea why a previously working heat map would suddenly stop showing heat?
There are a few messages, but no errors or warnings. Messages in the console tab are:
- [Violation] ‘DOMContentLoaded’ handler took 1457ms
- [Violation] ‘requestAnimationFrame’ handler took 1225ms
- [Violation] Forced reflow while executing JavaScript took 67ms
This is a repeat because I responded to a request for more information, but I did so as an answer and didn’t know how to clean up the post. Sorry everyone.
Kr,
-R
Edit
I have included the json from the tile. It was all generated by the interface and was working at some point. The MPs are still intact and the counter still very much relevant. I am still able to see the SCOM dashboards.
{
“id”: “####”,
“type”: “page/scomdashboard”,
“title”: “VMware Capacity - Template”,
“content”: {
“_type”: “tile/scomperf-as-heatmap”,
“config”: {
“context”: {
“scope”: {
“classId”: “####”,
“groupId”: “”,
“criteria”: “”
},
“extendedProperties”: true
},
“source”: {
“aggregateValueType”: “average”,
“resolution”: “raw”,
“objectname”: “VMHost-memory”,
“countername”: “memoryPressure”
},
“display”: {
“sizeScale”: 13,
“red”: 7,
“green”: 182,
“blue”: 165,
“sizeProperty”: “properties.numHosts”,
“height”: 27,
“alpha”: 255
}
},
“title”: “Host Memory Pressure Vs Host Count”,
“description”: “”
}
“derivedFrom”: “00000000-0000-0000-0000-000000000000”
}